Tipsy

Tipsy

Network Analytics & Growth Intelligence for Web3 Social (2025)

Data VisualizationNetwork AnalysisFarcasterSocialFi
Client: Farcaster EcosystemYear: 2025
01

Market Thesis & Objective

Visualizing the health of the Web3 attention economy

In Web3 social (SocialFi), tipping is more than just a payment; it is a signal of high-trust engagement and content quality. However, protocols lack visibility into how this capital actually flows. I built Tipsy as a network analytics tool to visualize the nascent tipping economy on Farcaster via the Noice app. The goal was to identify super-connectors, measure network density, and prove that social capital was compounding into financial capital.

  • Role: Builder & Data Strategist
  • Data Source: Farcaster network (Noice App) via Dune Analytics/Open APIs.
  • Objective: Map the flow of USDC to identify high-LTV users and network bottlenecks.
  • Scope: Snapshot of USDC tips ($1+) exchanged in June 2025.
02

System Design: Abstracting Network Data

Translating ledger logs into interactive graphs

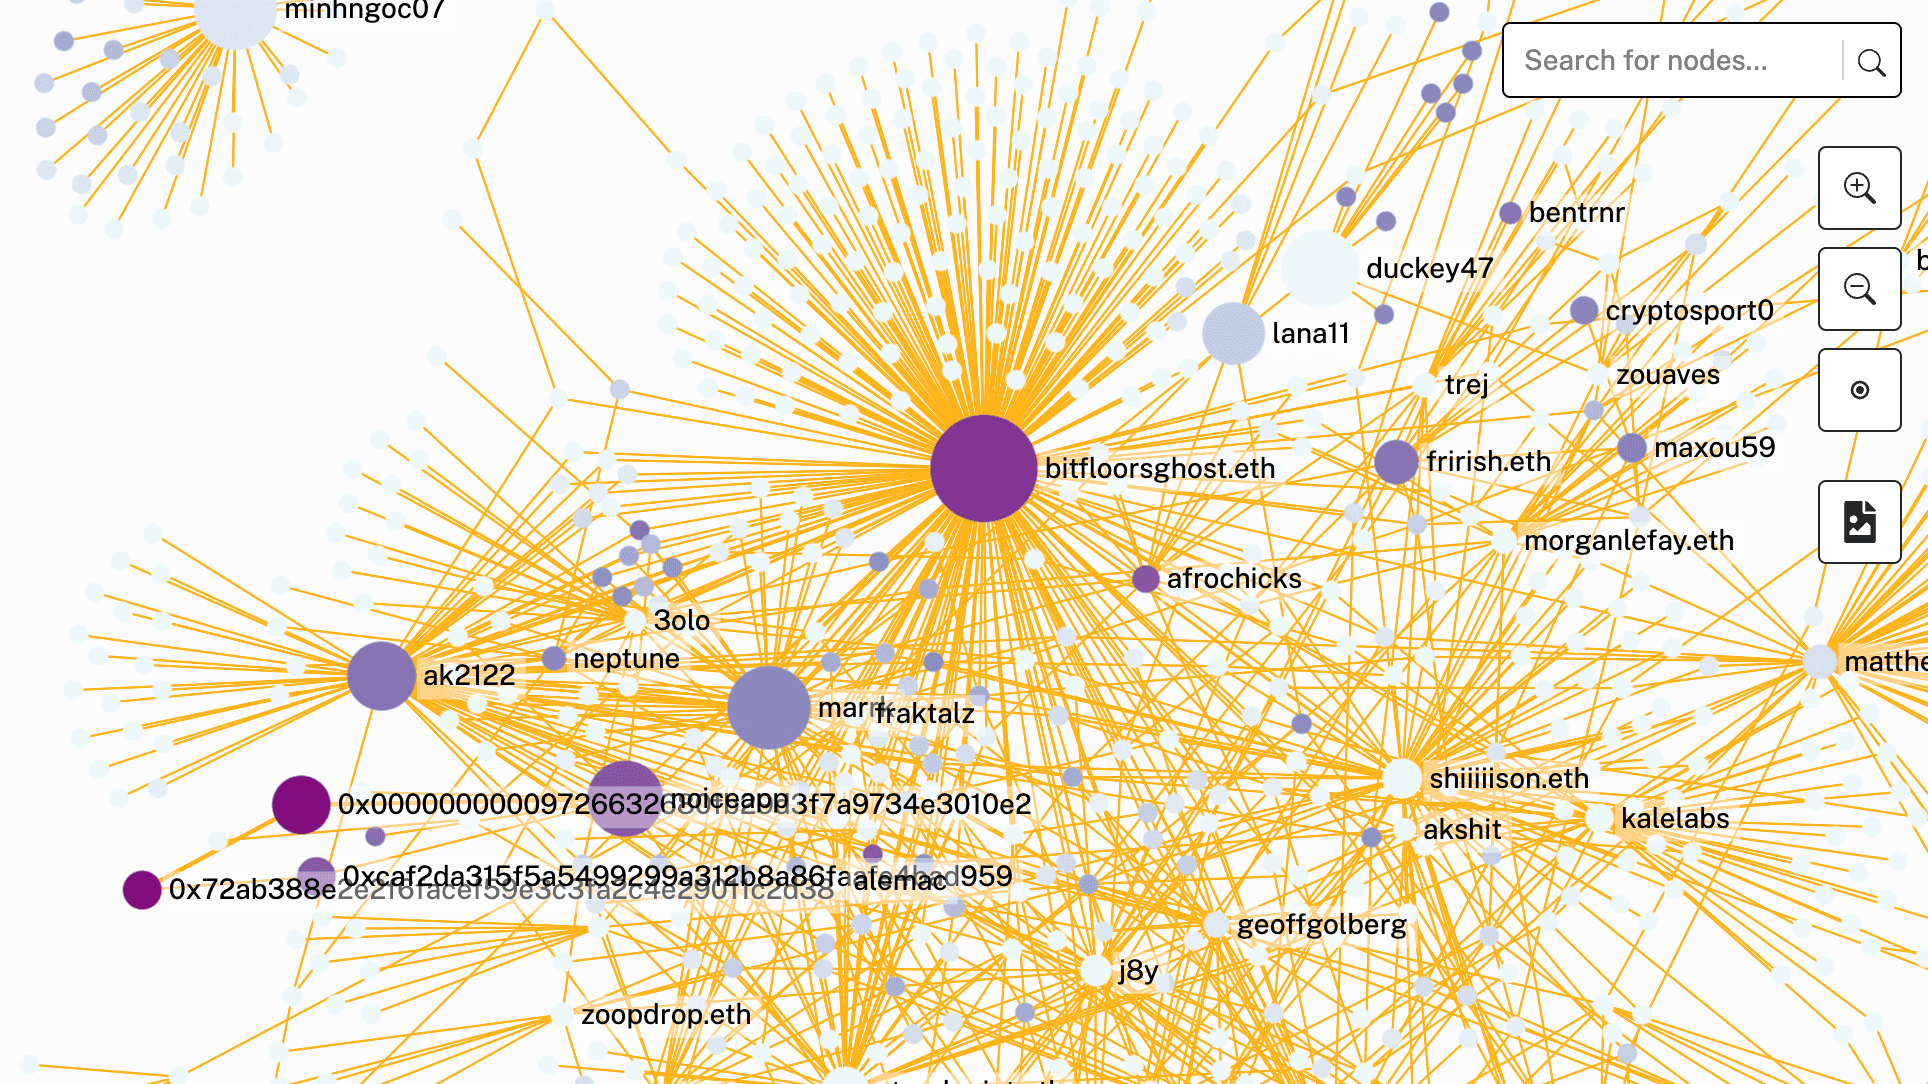
To make raw blockchain data consumable for product strategy, I built an interactive visualization engine. The system queries transaction logs and maps them to a force-directed graph, rendering users as nodes and transactions as edges. This allows for real-time exploration of complex social capital flows that would be impossible to read in a spreadsheet, allowing users to isolate specific nodes and trace capital paths.

  • Node Architecture: Size mapped to total USDC sent (Generosity/Outbound Capital).
  • Influence Mapping: Color depth mapped to USDC received (Social Trust/Inbound Capital).
  • Edge Weight: Line thickness represents aggregate transaction volume between two nodes.
Project image 1
03

Product Insights & Network Effects

What the data revealed about Farcaster's economy

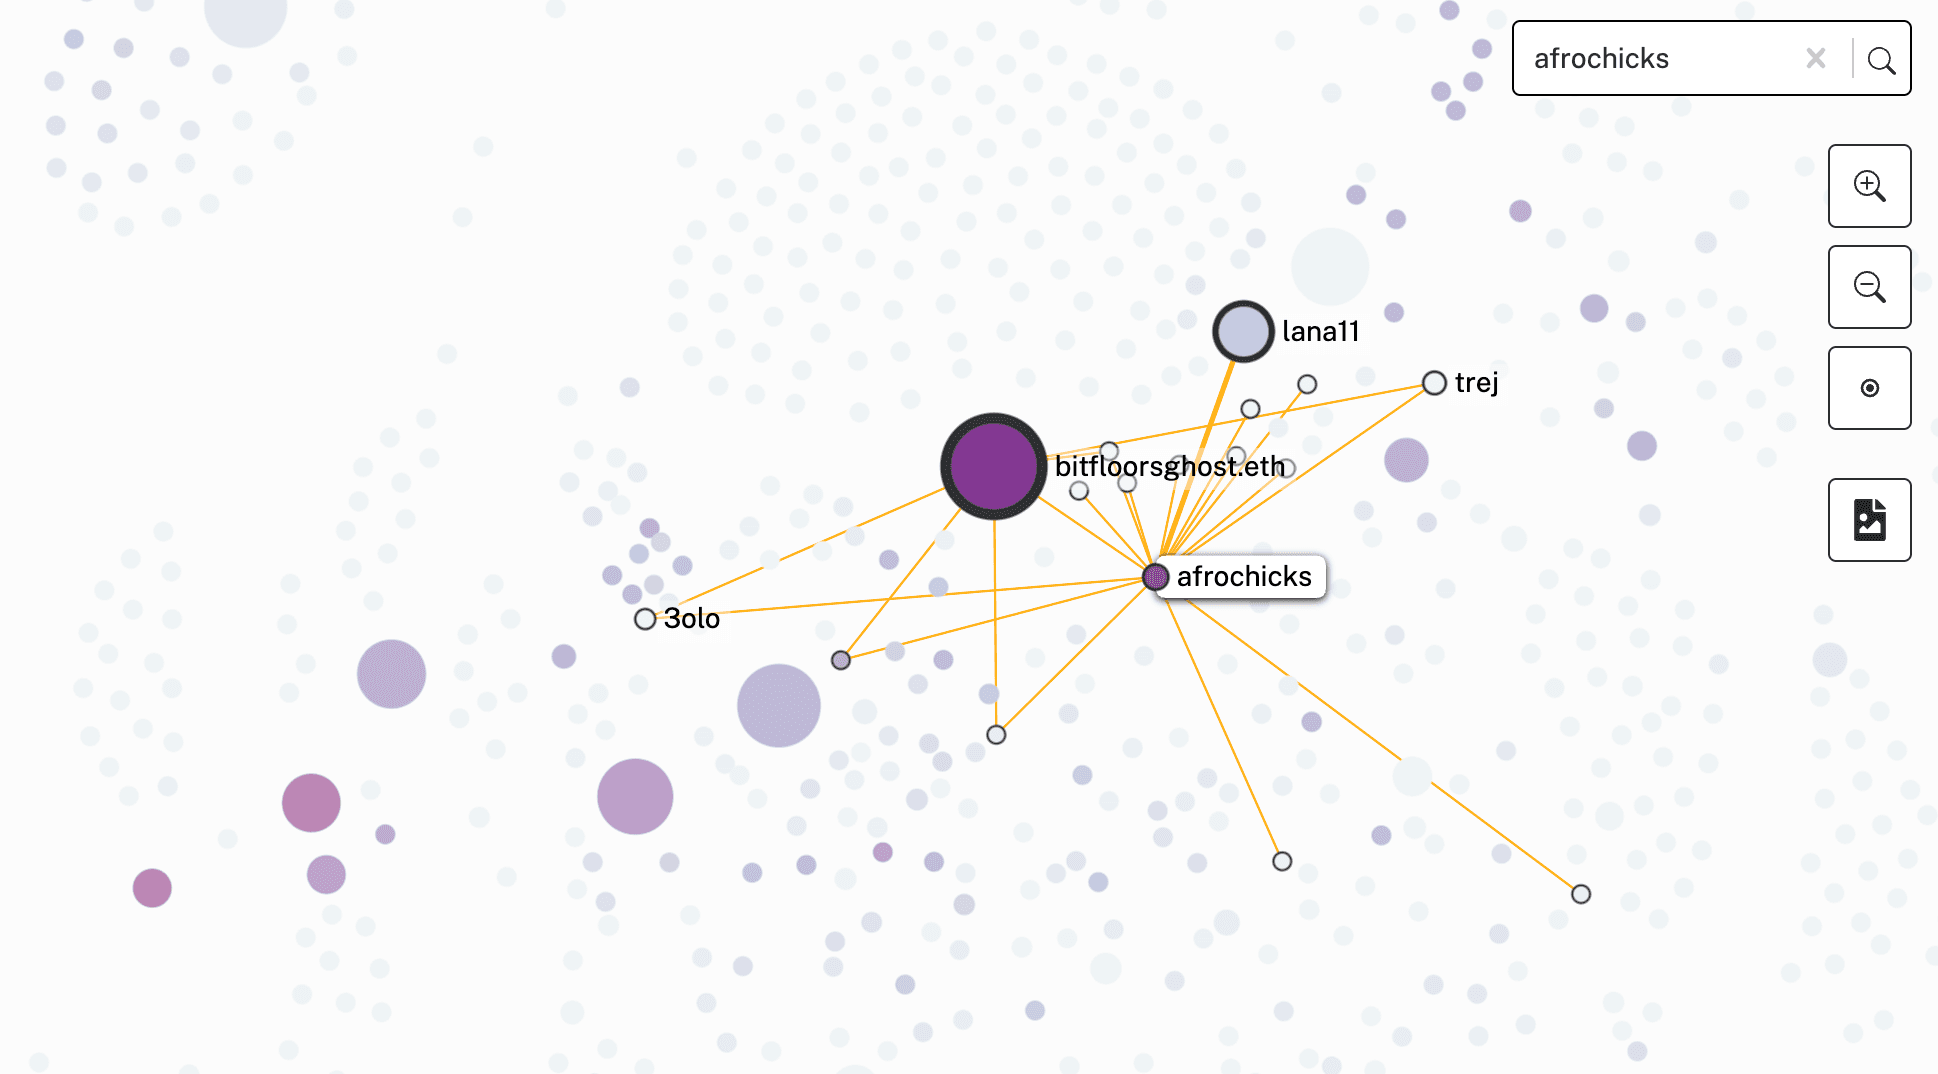
The visualization wasn't just pretty; it exposed the underlying mechanics of the Farcaster economy. By interacting with the graph (hovering to isolate connections, searching for specific users), we could identify the 'whales' who were acting as decentralized liquidity providers for creators, and see which sub-communities had the highest velocity of social capital.

  • Power Law Distribution: Confirmed that tipping volume is heavily concentrated among a core group of high-trust nodes.
  • Virality Tracking: Traced how a single tip from a high-influence node cascaded through the network to smaller creators.
  • Strategic Value: Provided actionable intelligence on which users the protocol should incentivize to retain network density.